Sections / Gems / 3D and WebGL data pieces
Ribbon Ledger
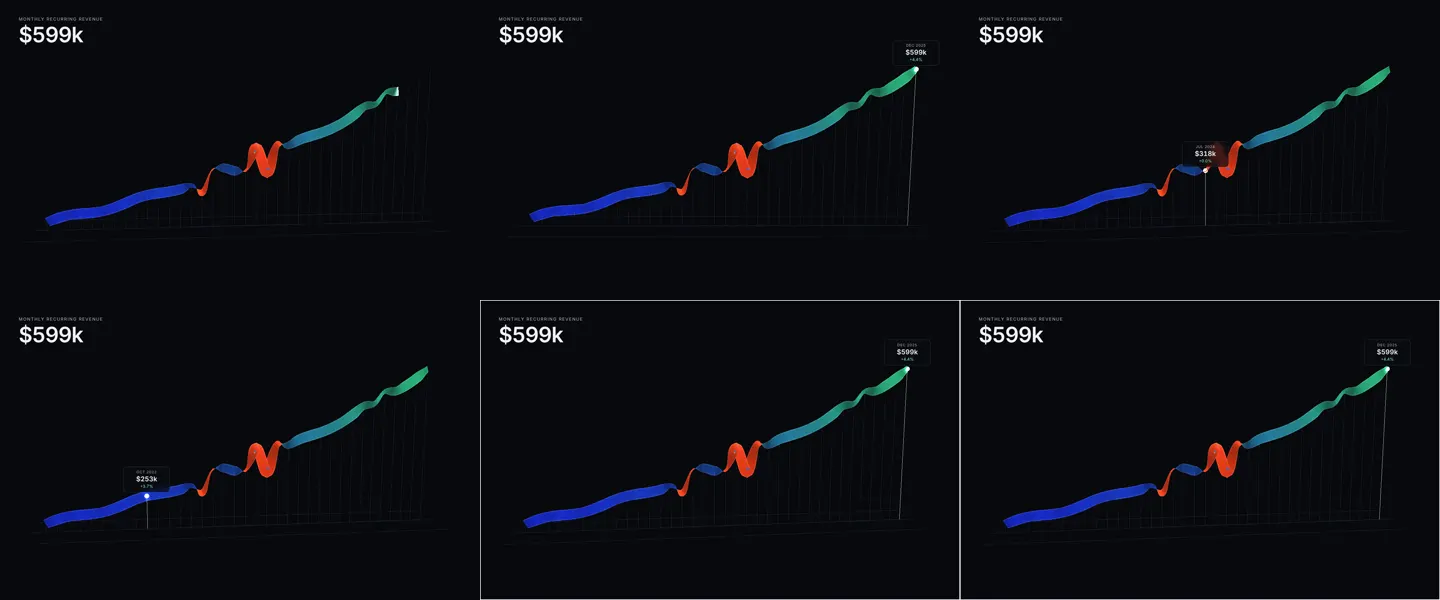
A time series as a lit 3D ribbon. Calm stretches lie flat and face you; where the numbers jump around, the ribbon twists and shows its other, differently coloured side, so volatility is something you see before you read it. Move along it to read any point, drag to turn it, step through it with the arrow keys. The series is also a real table underneath.
- Kind
- 3D and WebGL data pieces
- Interaction
- WebGL · time series · scrub · drag to orbit · keyboard · data table
- Dependencies
- three 0.180.0
- Licence
- Licensed with Full Access, for the sites you build; do not resell the gem itself
Formats
- Webflow (native)
- Figma (layers)
- Framer component
- HTML
- Prompts for Claude Code, Cursor, Lovable, v0, Bolt
Copy to Webflow pastes a native section with the gem in an Embed inside it. Copy to Figma pastes a frame of its best moment, text and controls as layers. Copy to Framer pastes a component with its options as controls. HTML is one self-contained snippet. Each prompt (Claude Code, Cursor, Lovable, v0, Bolt) carries the exact files, so your agent installs this gem, not a lookalike. With the MCP server, ask your agent for get_section("ribbon-ledger").
Behaviour and accessibility
- Twist comes from the data: each point's distance from the line between its neighbours, so a smooth series stays flat and a jumpy one turns over.
- The plot is a labelled slider: arrow keys, Page Up and Down, Home and End read point by point, and each value is spoken with its change on the period before. The whole series is also a visually hidden table.
- Mouse: hover reads, drag turns the ribbon. Touch: tap reads, and dragging still scrolls the page.
- The ribbon draws itself in the first time it is seen; drawing stops entirely off screen or in a background tab.
- With prefers-reduced-motion: no draw-in or idle sway, the marker jumps, and it renders only when something changes.
- three.js 0.180.0: the vanilla build imports it from jsDelivr, the React build from npm.
Options
| Option | Type | Default | What |
|---|---|---|---|
data | LedgerPoint[] | 36 built in | The series, oldest first. Two points or more. |
title | string | "Monthly recurring revenue" | The series' name, shown over the ribbon and used as the table caption. |
prefix | string | "$" | Written before every value ($). |
suffix | string | "k" | Written after every value (k, %, ms). |
decimals | number | 0 | Decimal places shown. |
colorLow | string | "#5b7cfa" | Ribbon colour at the lowest values. |
colorHigh | string | "#7ff0c8" | Ribbon colour at the highest values. |
colorBack | string | "#ff8a5c" | Colour of the ribbon's back face, shown where it twists. |
background | string | "#08090d" | Background (any CSS colour, or transparent). |
twist | number | 1 | How far volatility twists the ribbon: 1 lets the wildest stretch turn right over. 0 keeps it flat. |
orbit | boolean | true | Drag to turn the ribbon. |
onScrub | (index: number) => void | Called when the point being read changes. |

 Free
Free